What is an R multiple, and why rupees mislead you
You made ₹8,000 on one trade and ₹40,000 on another. Which was the better trade? Almost everyone answers the second one, and almost everyone is wrong about half the time — because the rupee figure leaves out the only thing that makes two trades comparable.
What R actually is
R is one unit of risk. Not the money you put in — the money you stood to lose if the trade went against you and your stop was hit.
For one position it is the distance from your entry to your stop, multiplied by how many shares you hold:
1R  =  (entry price − stop price) × quantity

R multiple  =  profit or loss ÷ 1R
A trade that makes twice what you risked is +2R. One that loses exactly what you planned to is −1R. One stopped out for slightly more than planned, because the price gapped through your stop, is −1.3R — and that overshoot is worth seeing, which a rupee figure hides.
The two trades, worked through
Take the pair from the opening, with real arithmetic.
Trade A — the ₹8,000 win
- Buy 200 shares at ₹620
- Stop at ₹600 — risking ₹20 a share
- 1R = 20 × 200 = ₹4,000
- Sold at ₹660 → profit ₹8,000
- = +2R
Trade B — the ₹40,000 win
- Buy 500 shares at ₹1,200
- Stop at ₹1,120 — risking ₹80 a share
- 1R = 80 × 500 = ₹40,000
- Sold at ₹1,280 → profit ₹40,000
- = +1R
Trade B made five times the money. Trade A was twice the trade. To earn that ₹40,000, B put ₹40,000 at risk — it returned exactly what it risked. A returned double.
Now run each thirty times. Thirty of A, at the same win rate, compounds. Thirty of B breaks even before costs. The rupee column would have told you B was your best setup and to do more of it.
What R lets you see that rupees cannot
Whether your system actually pays
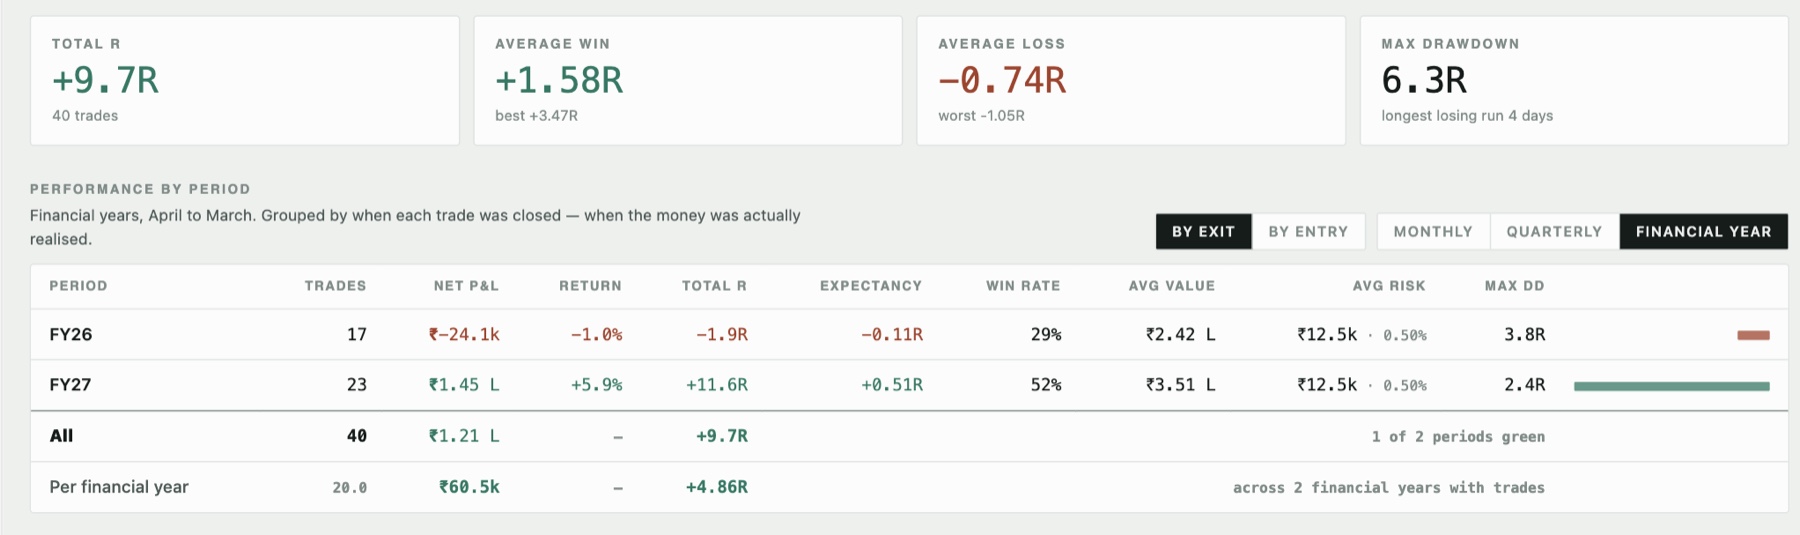
Once every trade is in R you can average them, which you cannot honestly do with rupees across positions of different sizes. That average is your expectancy — what one trade is worth, before you know how it turns out:
expectancy = (win rate × average win) − (loss rate × average loss)

50% wins at +2R, 50% losses at −1R
   = (0.50 × 2) − (0.50 × 1)
   = +0.5R per trade
Half your trades losing, and the system still pays half a unit of risk every time you take one. That is the number worth knowing, and it only exists in R.
Which setups deserve your money
Sort your trades by pattern, or by how far price was extended when you entered, or by how long you held. In rupees the answer is dominated by whichever trades happened to be large. In R, a flat base and a pullback compare directly even if one was a ₹50,000 position and the other ₹5 lakh.
How big the next position should be
R makes sizing arithmetic instead of instinct. Decide what one loss may cost — say 0.5% of a ₹20 lakh account, so ₹10,000 — and the quantity falls out:
quantity = risk budget ÷ (entry − stop)
         = 10,000 ÷ (620 − 600)
         = 500 shares
A wider stop buys fewer shares. That is the mechanism that stops a volatile stock quietly becoming your largest position.
Three things that trip people up
1. Costs are part of the answer
An R computed on gross profit flatters every trade. In Indian equity the round trip carries STT on both legs of a delivery trade, exchange transaction charges (which differ between NSE and BSE), the SEBI turnover fee, stamp duty on the buy, GST on brokerage and fees, and a DP charge on every sell. On a small position those can be a meaningful slice of a 1R move.
Measure R on what actually reached your account. A setup that looks marginally profitable gross is often losing net, and that is exactly the setup worth catching.
2. Selling in parts does not change the trade
Sell a third at +3R and the rest later, and the position is still one decision with one risk. 1R was fixed when you entered; it does not shrink because you took some off. Recording each tranche as its own trade triples your trade count and gives each fragment its own R against a position you only sized once.
3. Moving your stop up
Here the honest answer is that there are two schools, and you should pick deliberately.
Most writing says pin 1R at entry: you sized the position against that risk, so raising your stop later should not retroactively change what the trade risked.
The other view — the one LedgeRR takes — is that a trade has one stop: the risk you actually took. Trailing happens at your broker, where it belongs, and the number in the journal changes only when it was recorded wrong. That keeps a mistyped stop from permanently distorting every R that follows, at the cost of showing more open risk than a protected position really carries.
Either is defensible. Holding both at once is not, and that is the mistake to avoid: two stops in one record means every R figure depends on which one a given screen happened to read.
Where to start
You need three numbers per trade — entry, stop, quantity — and the discipline to record the stop before you know how it ended. That last part is the whole difficulty: a stop invented afterwards is a story, and it makes every R downstream fiction.
Roughly twenty trades in, expectancy starts to mean something. Before that you are reading noise.
LedgeRR measures every trade in R, works Indian charges out to the paisa, and imports the trades you have already made from your broker’s tax P&L.
Start your journal — it's free